The Performance 500
Google recently announced that Page Rank changes are coming: performance metrics (Core Web Vitals like Largest Contentful Paint, Cumulative Layout Shift and First Input Delay) will soon be taken into account for prioritizing search listings.
We wanted to see how some of America's top companies —The Fortune 500— would stack up against each other when viewed in a different light: website performance. Is there a correlation between business performance and Page Speed performance? What else might we find?
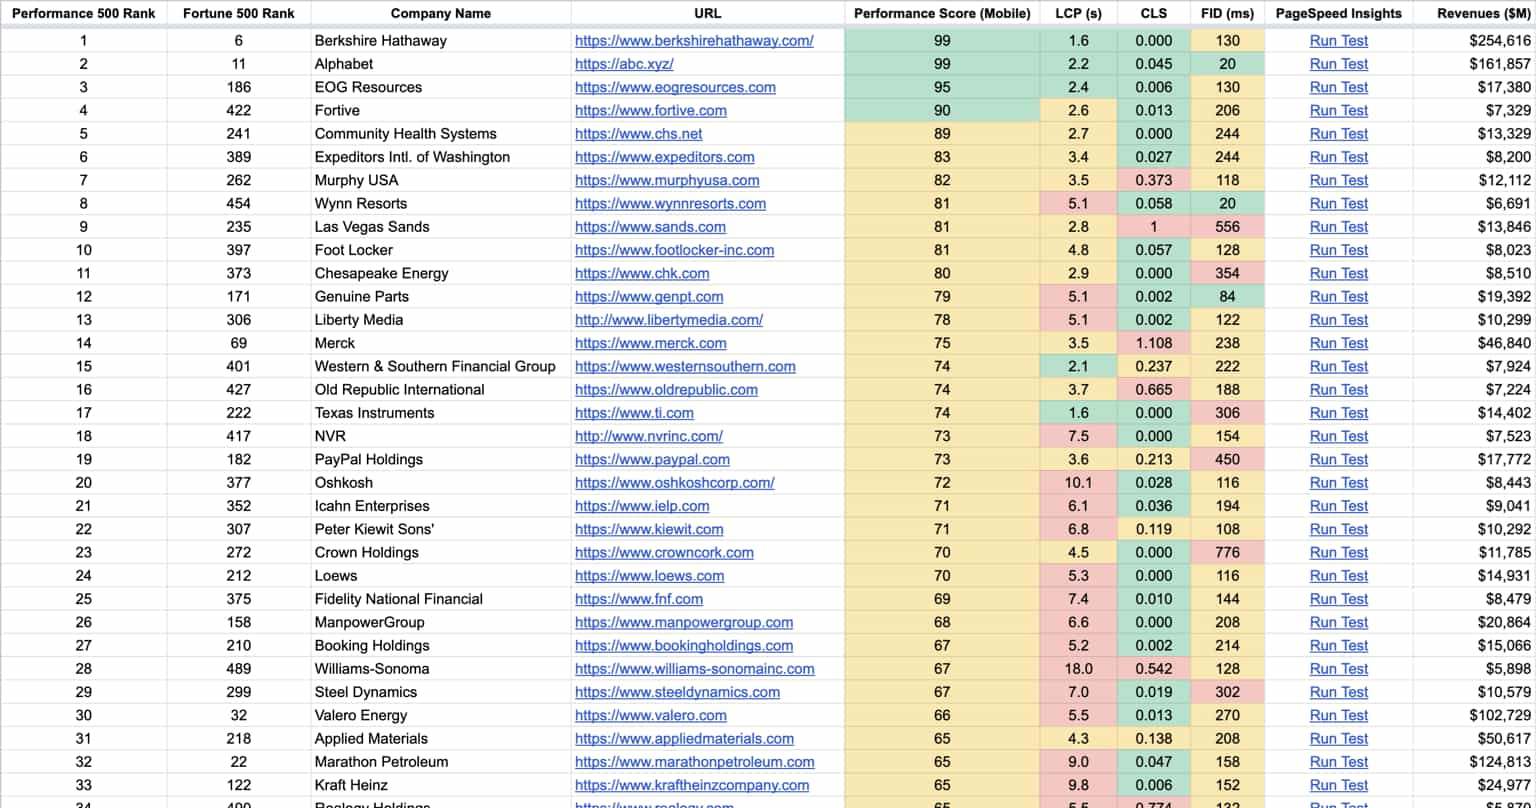
Using Google’s PageSpeed Insights API and 2020 Fortune 500 data, we compiled what we’re calling “The Performance 500”.
And the Winner Is
You’ll notice a recognizable name in first place for the Performance 500: Berkshire Hathaway. Its Chairman and CEO, Warren Buffet, famous for continuing to live in the same house he purchased in 1958, bested even Google’s parent company in page speed performance using a simple HTML site with minimal resources to deliver content. Hats off to you, Warren and team.
Other Interesting Findings
- Only 4 sites out of the 500 (.8%) scored above a 90% or above on their PageSpeed Insights Performance Score
- ~85% (424/500) of sites have a Performance Score of less than 50
- The average Performance Score is ~29
- The average Largest Contentful Paint (LCP) metric is 13.5 seconds(!)
- Less than half of the Fortune 500 had a Cumulative Layout Shift (CLS) Score of better than .1
- Only 11 of the 500 have "Good" First Input Delay (FID) scores
Understanding Core Web Vitals (LCP, CLS & FID)
A quick reference:
- LCP: Largest Contentful Paint - How long does it take to render the largest element within the viewport (measured in seconds)
- CLS: Cumulative Layout Shift - How often things move around as the page loads (presented as a score value)
- FID: First Input Delay - How soon after a user input does the browser process the event (measured in milliseconds)
We’ve included a section below that explains these in further detail in the language used on web.dev.
How We Tested
We ran 5 tests at different times of day over a period of two weeks. Those results have been averaged into the scores presented in the table above. PageSpeed Insights never returned a Performance Score for ViacomCBS so we ranked it last.
Ranking Methodology
We chose to rank these companies “Performance 500” rank first by Google’s PageSpeed Insights Performance Score, then by Largest Contentful Paint (LCP), then by Cumulative Layout Shift (CLS), then First Input Delay (FID). We preferred this ranking order as FID is not assigned a weight in Google’s weighting of the performance score.
Color Coding
We chose to use the green, yellow and red labels using the same color coding scheme used by Page Speed Insights. These vary by metric and can be found in the PageSpeed Insights documentation.
Device Type
We also chose to only show the mobile rankings of these sites. A prior version of this table existed with desktop scores as well but we felt it was too cluttered to meaningfully show desktop and mobile metrics in the same table.
Understanding Core Web Vitals (Loading, Visual Stability, and Interactivity Metrics)
Starting next May, as Google Search Results start to take into account Loading (Largest Contentful Paint), Interactivity (First Input Delay) and Visual Stability (Cumulative Layout Shift) metrics, sites that have not focused on improving these metrics will be penalized against sites that are faster to load. Let’s take a look at each of these categories.
Loading: Largest Contentful Paint (LCP)
Google's Definition: The Largest Contentful Paint (LCP) metric reports the render time of the largest image or text block visible within the viewport. web.dev

Visual Stability: Cumulative Layout Shift (CLS)
Google's Definition: CLS measures the sum total of all individual layout shift scores for every unexpected layout shift that occurs during the entire lifespan of the page.
A layout shift occurs any time a visible element changes its position from one rendered frame to the next. web.dev

Interactivity: First Input Delay (FID)
Google's Definition: FID measures the time from when a user first interacts with a page (i.e. when they click a link, tap on a button, or use a custom, JavaScript-powered control) to the time when the browser is actually able to begin processing event handlers in response to that interaction. web.dev

Incentivizing A Faster Web
We think these Page Rank changes from Google will have a positive impact, incentivizing companies to focus on improving page speed performance and ultimately the user experience.
Special thanks to Lekshmi Nair’s repo as a starter for most of the 2020 Fortune 500 company data in this table.


